Programming/python
[matplotlib] 여러 데이터
그렉그의
2023. 3. 27. 17:18
07. 여러데이터
In [3]:
import matplotlib.pyplot as pltimport matplotlibmatplotlib.rcParams['font.family'] = 'AppleGothic' matplotlib.rcParams['font.size'] = 15 #글자크기matplotlib.rcParams['axes.unicode_minus'] = False #한글폰트 사용시 마이너스 글자 깨짐 해결In [4]:
x = [1,2,3]y = [2,4,8]covid-19 백신 종류별 접종 인구
In [5]:
days = [1,2,3] #10월 1일,2일,3일az=[2,4,8] #(단위: 만명) 1일부터 3일까지 아스트라제네카 접종 인구pfizer= [5,1,3]moderna= [1,2,5]plt.plot(days, az)plt.plot(days, pfizer)plt.plot(days, moderna)Out[5]:
[<matplotlib.lines.Line2D at 0x7fd81aa35c70>]
In [7]:
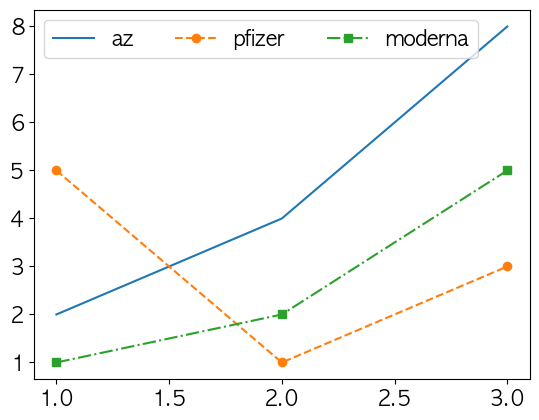
plt.plot(days, az, label = 'az')plt.plot(days, pfizer, label='pfizer', marker='o', ls='dashed')plt.plot(days, moderna, label='moderna', marker='s', ls = '-.')plt.legend() #plt.legend 꼭 적어줘야 함Out[7]:
<matplotlib.legend.Legend at 0x7fd81addae50>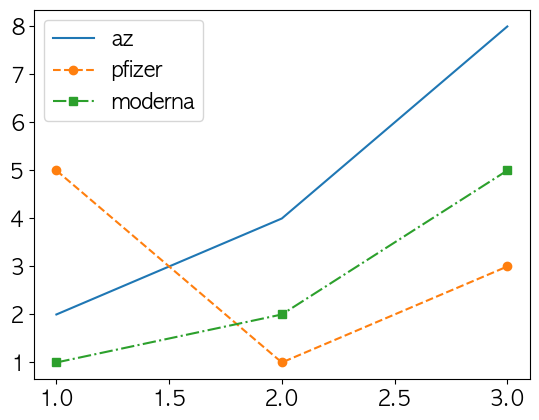
In [8]:
plt.plot(days, az, label = 'az')plt.plot(days, pfizer, label='pfizer', marker='o', ls='dashed')plt.plot(days, moderna, label='moderna', marker='s', ls = '-.')plt.legend(ncol=3) #plt.legend 꼭 적어줘야 함<matplotlib.legend.Legend at 0x7fd81ad95640>