12. 다중막대 그래프
In [1]:
import pandas as pdIn [2]:
import matplotlib.pyplot as pltimport matplotlibmatplotlib.rcParams['font.family'] = 'AppleGothic' matplotlib.rcParams['font.size'] = 15 #글자크기matplotlib.rcParams['axes.unicode_minus'] = False #한글폰트 사용시 마이너스 글자 깨짐 해결In [3]:
df = pd.read_excel('../Pandas/score.xlsx')dfOut[3]:
지원번호이름학교키국어영어수학과학사회SW특기01234567
| 1번 | 채치수 | 북산고 | 197 | 90 | 85 | 100 | 95 | 85 | Python |
| 2번 | 정대만 | 북산고 | 184 | 40 | 35 | 50 | 55 | 25 | Java |
| 3번 | 송태섭 | 북산고 | 168 | 80 | 75 | 70 | 80 | 75 | Javascript |
| 4번 | 서태웅 | 북산고 | 187 | 40 | 60 | 70 | 75 | 80 | NaN |
| 5번 | 강백호 | 북산고 | 188 | 15 | 20 | 10 | 35 | 10 | NaN |
| 6번 | 변덕규 | 능남고 | 202 | 80 | 100 | 95 | 85 | 80 | C |
| 7번 | 황태산 | 능남고 | 188 | 55 | 65 | 45 | 40 | 35 | PYTHON |
| 8번 | 윤대협 | 능남고 | 190 | 100 | 85 | 90 | 95 | 95 | C# |
In [6]:
import numpy as np In [8]:
np.arange(5)Out[8]:
array([0, 1, 2, 3, 4])In [9]:
np.arange(3,6)Out[9]:
array([3, 4, 5])In [10]:
arr = np.arange(5)arrOut[10]:
array([0, 1, 2, 3, 4])In [11]:
# 각 요소에 100을 더해줌arr+100Out[11]:
array([100, 101, 102, 103, 104])In [12]:
arr * 3Out[12]:
array([ 0, 3, 6, 9, 12])In [14]:
df.shape# 앞은 row, 뒤는 ColumnOut[14]:
(8, 10)In [15]:
df.shape[0]Out[15]:
8In [16]:
N = df.shape[0]NOut[16]:
8In [18]:
index = np.arange(8)indexOut[18]:
array([0, 1, 2, 3, 4, 5, 6, 7])In [21]:
w = 0.25plt.bar(index-w,df['국어'])plt.bar(index, df['영어'])plt.bar(index+w, df['수학'])Out[21]:
<BarContainer object of 8 artists>
In [22]:
w = 0.25plt.bar(index-w,df['국어'], width = w)plt.bar(index, df['영어'], width = w)plt.bar(index+w, df['수학'], width = w)Out[22]:
<BarContainer object of 8 artists>
In [25]:
w = 0.25plt.bar(index-w,df['국어'], width = w, label = '국어')plt.bar(index, df['영어'], width = w, label = '영어')plt.bar(index+w, df['수학'], width = w, label = '수학')plt.legend(ncol= 3)Out[25]:
<matplotlib.legend.Legend at 0x7ff4680ba730>
In [31]:
#크기 plt.figure(figsize = (10,5))plt.title('학생 별 성적')w = 0.25plt.bar(index-w,df['국어'], width = w, label = '국어')plt.bar(index, df['영어'], width = w, label = '영어')plt.bar(index+w, df['수학'], width = w, label = '수학')plt.legend(ncol= 3)plt.xticks(index, df['이름'], rotation = 60, size = 12)plt.show()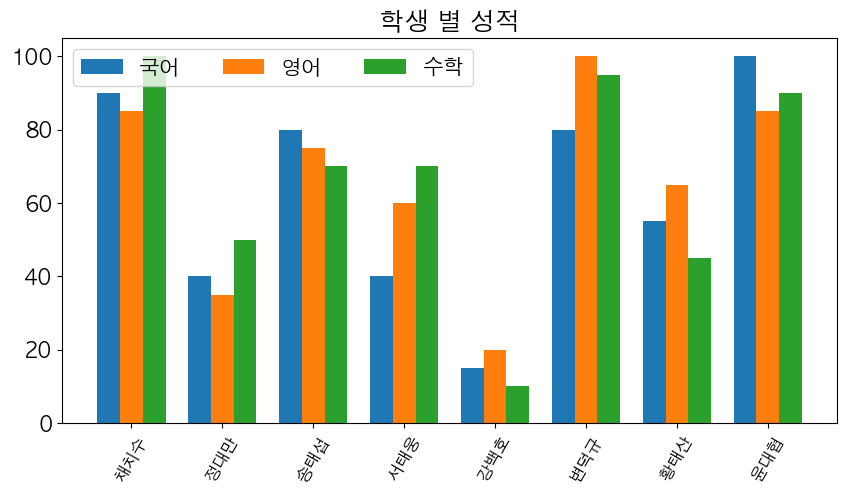
'Programming > python' 카테고리의 다른 글
| [matplotlib] 원그래프 (심화) (0) | 2023.03.27 |
|---|---|
| [matplotlib] 원 그래프 (기본) (0) | 2023.03.27 |
| [matplotlib] 누적 막대 그래프 (0) | 2023.03.27 |
| [matplotlib] Data Frame (0) | 2023.03.27 |
| [matplotlib] 막대 그래프(심화) (0) | 2023.03.27 |


