14. 원 그래프 (심화)
In [2]:
import matplotlib.pyplot as pltimport matplotlibmatplotlib.rcParams['font.family'] = 'AppleGothic' matplotlib.rcParams['font.size'] = 15 #글자크기matplotlib.rcParams['axes.unicode_minus'] = False #한글폰트 사용시 마이너스 글자 깨짐 해결In [3]:
values = [30, 25, 20, 13, 10, 2]labels= ['Python','Java','Javascript','C#','C++','ETC']# colors = ['b','g','r','c','m','y'] # 원 그래프 내 색깔 바꾸기colors = ['#ffadad', '#ffd6a5', '#fdffb6', '#caffbf', '#9bf6ff', '#a0c4ff']explode = [0.05]*6plt.pie(values, labels= labels, autopct = '%.1f%%', startangle=90, counterclock = False, colors=colors, explode = explode)plt.show()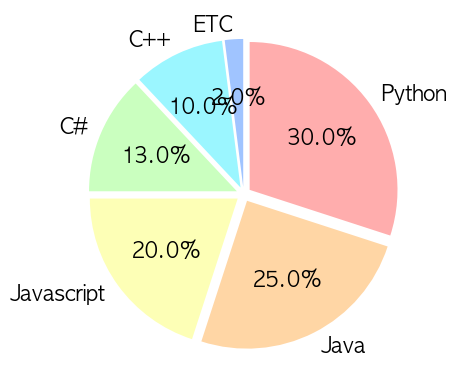
In [4]:
wedgeprops = {'width': 0.5 }plt.pie(values, labels= labels, autopct = '%.1f%%', startangle=90, counterclock = False, colors=colors, explode = explode, wedgeprops= wedgeprops)plt.show()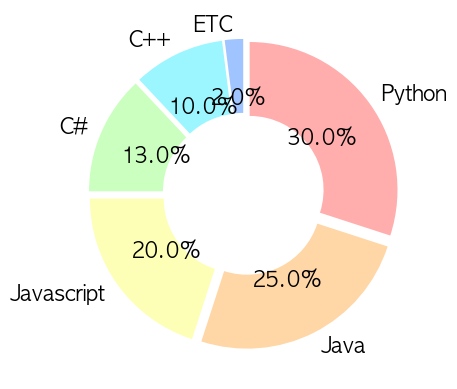
In [5]:
# explode 없애기wedgeprops = {'width': 0.5 }plt.pie(values, labels= labels, autopct = '%.1f%%', startangle=90, counterclock = False, colors=colors, wedgeprops= wedgeprops)plt.show()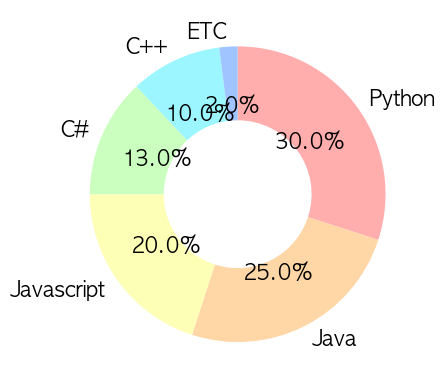
In [6]:
# 사이 간격을 흰색으로 만들기wedgeprops = {'width': 0.5, 'edgecolor':'w', 'linewidth':2 }plt.pie(values, labels= labels, autopct = '%.1f%%', startangle=90, counterclock = False, colors=colors, wedgeprops= wedgeprops)plt.show()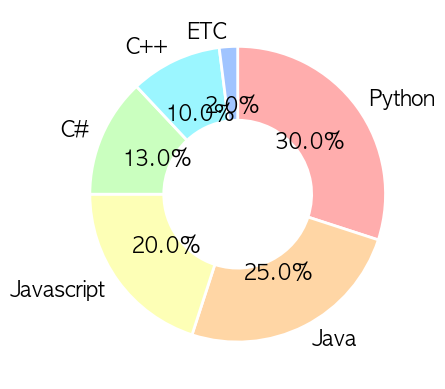
In [1]:
def custom_autopct(pct):# float로 return ('%.1f%%' %pct) if pct >= 10 else '' return '{:.1f}%'.format(pct) if pct >=10 else ''# 정수만 return '{:.0f}%'.format(pct) if pct >=10 else ''# pctdistance = 글자들이 중심지로부터 얼마나? plt.pie(values, labels= labels, autopct = custom_autopct, pctdistance=0.7, startangle=90, counterclock = False, colors=colors, wedgeprops= wedgeprops)plt.show()---------------------------------------------------------------------------
NameError Traceback (most recent call last)
/var/folders/8d/dnhtj6sj0b535gq41n6_fr000000gn/T/ipykernel_3483/2042834929.py in <module>
6 return '{:.0f}%'.format(pct) if pct >=10 else ''
7 # pctdistance = 글자들이 중심지로부터 얼마나?
----> 8 plt.pie(values, labels= labels, autopct = custom_autopct, pctdistance=0.7, startangle=90, counterclock = False, colors=colors, wedgeprops= wedgeprops)
9 plt.show()
NameError: name 'plt' is not defined
Data Frame 활용
In [29]:
import pandas as pd df= pd.read_excel('../Pandas/score.xlsx')dfOut[29]:
지원번호이름학교키국어영어수학과학사회SW특기01234567
| 1번 | 채치수 | 북산고 | 197 | 90 | 85 | 100 | 95 | 85 | Python |
| 2번 | 정대만 | 북산고 | 184 | 40 | 35 | 50 | 55 | 25 | Java |
| 3번 | 송태섭 | 북산고 | 168 | 80 | 75 | 70 | 80 | 75 | Javascript |
| 4번 | 서태웅 | 북산고 | 187 | 40 | 60 | 70 | 75 | 80 | NaN |
| 5번 | 강백호 | 북산고 | 188 | 15 | 20 | 10 | 35 | 10 | NaN |
| 6번 | 변덕규 | 능남고 | 202 | 80 | 100 | 95 | 85 | 80 | C |
| 7번 | 황태산 | 능남고 | 188 | 55 | 65 | 45 | 40 | 35 | PYTHON |
| 8번 | 윤대협 | 능남고 | 190 | 100 | 85 | 90 | 95 | 95 | C# |
In [30]:
grp = df.groupby('학교')grpOut[30]:
<pandas.core.groupby.generic.DataFrameGroupBy object at 0x7f77c4f38fd0>In [31]:
grp.size()Out[31]:
학교
능남고    3
북산고    5
dtype: int64
In [32]:
grp.size()['북산고']Out[32]:
5In [37]:
values = [grp.size()['북산고'],grp.size()['능남고']] #[5,3]labels = ['북산고','능남고']def custom_pct(pct): return '{:.0f}%'.format(pct) if pct >= 10 else ''plt.pie(values, labels= labels, autopct = custom_autopct, pctdistance=0.75, startangle=90, counterclock = False, colors=colors, wedgeprops= wedgeprops)plt.show()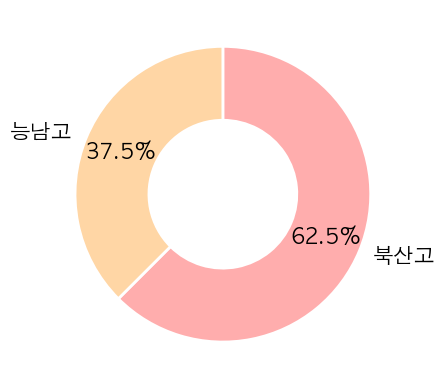
'Programming > python' 카테고리의 다른 글
| [matplotlib] 산점도 그래프 (0) | 2023.03.27 |
|---|---|
| [matplotlib] 원 그래프 (심화) (0) | 2023.03.27 |
| [matplotlib] 원 그래프 (기본) (0) | 2023.03.27 |
| [matplotlib] 다중막대 그래프 (0) | 2023.03.27 |
| [matplotlib] 누적 막대 그래프 (0) | 2023.03.27 |


